Gas Distribution Mapping with Mobile Robots
Why Map Gases with Robots?
Air quality monitoring traditionally relies on fixed stations — expensive installations that measure pollutant concentrations at a single point. A city might have five or ten such stations, each costing tens of thousands of euros to install and maintain. The result is a sparse data set: you know the air quality at those specific points, but the gaps between them can span kilometres.
Mobile robots offer an alternative. A robot equipped with gas sensors can traverse an area and build a spatial map of pollutant concentrations — a gas distribution map. The idea is conceptually simple but technically demanding, and the DustBot project was one of the first to implement it on an autonomous outdoor platform.
DustClean’s Sensor Array
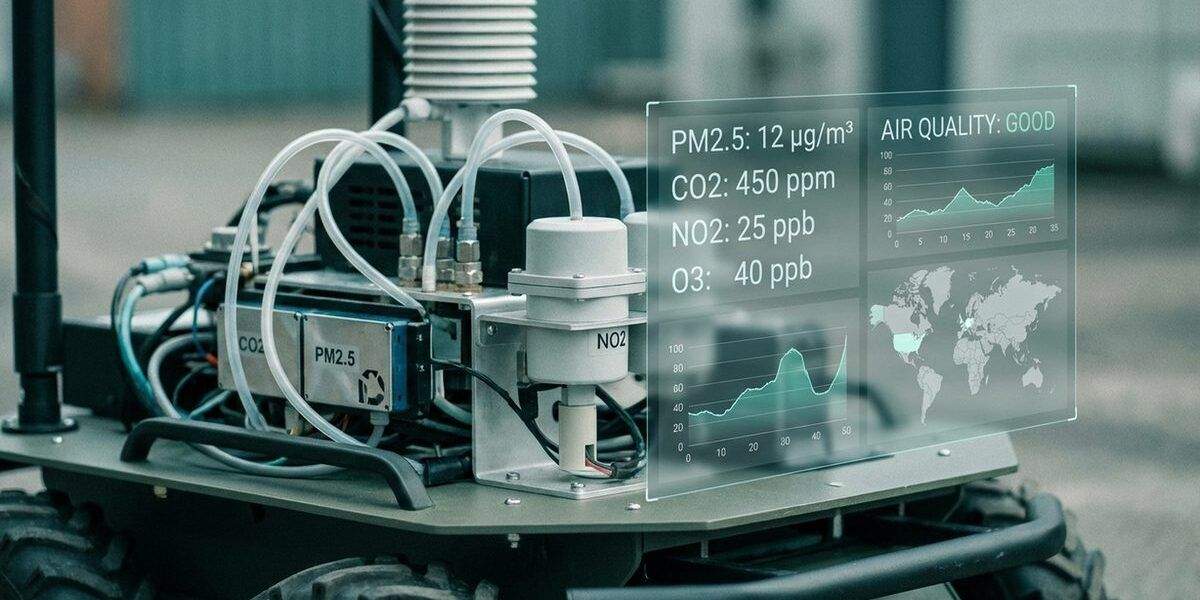
DustClean carried an array of electrochemical and metal oxide gas sensors capable of detecting:
- Nitrogen oxides (NOx) — primarily from vehicle exhaust
- Sulphur dioxide (SO2) — from industrial emissions and diesel combustion
- Ground-level ozone (O3) — a secondary pollutant formed by photochemical reactions
- Benzene (C6H6) — a carcinogenic volatile organic compound from fuel evaporation
- Carbon monoxide (CO) and carbon dioxide (CO2) — combustion byproducts
These sensors sampled continuously as the robot moved, with readings tagged with GPS coordinates and timestamps. The resulting data set was a time-series of geo-referenced concentration measurements — the raw material for gas distribution mapping.
The Mapping Challenge
Turning point measurements into a continuous spatial map is non-trivial. Gas concentrations are influenced by wind, temperature, humidity, source proximity, and turbulent mixing. A reading taken at point A tells you what the concentration was at that location at that moment, but conditions may have changed entirely by the time the robot reaches point B.
Achim Lilienthal and colleagues at Örebro University, who contributed to the DustBot project, developed several approaches to this problem. Their work on kernel-based methods used statistical techniques to interpolate between measurement points, weighting nearby readings more heavily and accounting for measurement uncertainty.
A key insight from Lilienthal’s research was the distinction between mean maps and variance maps. The mean map shows estimated concentrations across the area. The variance map shows where those estimates are uncertain — typically in areas the robot has not visited or where readings were highly variable. Together, they provide both information and a measure of confidence.
Kernel DM+V: The Algorithm
The Kernel DM+V (Distribution Mapping plus Variance) algorithm became one of the most cited contributions from the DustBot-adjacent research. It works as follows:
- Each sensor reading is treated as a data point with a spatial location and a concentration value.
- A kernel function (typically Gaussian) assigns weights to the influence of each reading on surrounding grid cells. Nearby cells receive higher weights; distant cells receive lower ones.
- For each grid cell, the weighted mean of all contributing readings produces the estimated concentration.
- The weighted variance provides a confidence measure.
The kernel bandwidth — how far each reading’s influence extends — is a critical parameter. Too narrow, and the map is patchy. Too wide, and local features are smoothed away. Lilienthal et al. proposed methods for adaptive bandwidth selection based on data density.
From the Lab: Smoke Plumes in a Wind Tunnel
Before I started working with outdoor robots, I spent a term in a fluid dynamics lab at Cambridge helping a colleague calibrate metal oxide gas sensors for a different project. We released controlled smoke plumes in a small wind tunnel and tried to reconstruct the plume geometry from mobile sensor readings. The experience was humbling. Even in a controlled indoor environment with known wind conditions, the reconstructed maps were noisy and unstable. The DustBot team’s achievement — producing usable gas distribution maps outdoors, where wind direction and speed vary constantly — demanded both clever algorithms and a willingness to accept imperfect data.
Applications Beyond DustBot
Gas distribution mapping with mobile robots has grown into a sub-field of its own. Current applications include:
- Leak detection — identifying gas leaks in industrial facilities using ground-based or aerial robots
- Agricultural monitoring — mapping greenhouse gas emissions (methane, nitrous oxide) from farmland
- Disaster response — identifying hazardous chemical concentrations after industrial accidents
- Urban air quality — the direct successor of DustBot’s approach, now pursued by several smart city initiatives
Drone-based gas mapping has become particularly active, as unmanned aerial vehicles can cover larger areas more quickly than ground robots. However, ground-based measurements remain important because gas concentrations at breathing height (1–2 metres) are what matter most for human health.
References
Lilienthal, A.J., Reggente, M., Trincavelli, M., Blanco, J.L., Gonzalez, J. (2009). “A Statistical Approach to Gas Distribution Modelling with Mobile Robots.” Autonomous Robots, 27(2), 155–167.
Mazzolai, B. et al. (2008). “DustBot: a networked system of autonomous robots for urban hygiene.” CLAWAR 2008.
Key References
- Lilienthal, A. & Duckett, T. (2004). “Building gas concentration gridmaps with a mobile robot.” Robotics and Autonomous Systems, 48(1), 3–16.